Is Tenant Flight Over?
Tracking multifamily tenant migration during COVID and beyond

A population analysis using GeoPhy’s Tenant Credit Profile data shows major U.S. metropolitan areas’ multifamily migration exodus in various phases. Looking at the 30 metro areas for which GeoPhy has the most multifamily tenant financial data, more than half have either stopped experiencing a fall in tenant populations or recovered previous drops. Many major markets, however, continue to see outflows
The winningest market? Tampa/St. Petersburg, which powered through the pandemic with no noticeable downturn.
The losers? Major gateway cities like San Francisco, New York, Boston, and Seattle.
For our analysis, we tracked multifamily tenant migration patterns from the start of the COVID pandemic through this past March. We divided the data at December, right as expectations for vaccines began to turn the economy around.
We then compared the trend in the number of multifamily tenants in each metro from the start of the pandemic to December, and then again from that point through now.
How Metros Break Down
The table below shows how the data for each metro area fell into one of five categories based on migration trends:
- Thriving: Significant growth in multifamily tenants before and after December
- Recovered: Observed multifamily tenant outflow in 2020, but tenant population is now back within 1% or less of its March 2020 total
- Bottomed: Significant multifamily tenant outflow has stabilized; still not recovering
- Still declining: Continued significant multifamily tenant outflow
- Minimal effect: Minor net changes in multifamily tenant population

In aggregate, the “Recovered” metros’ multifamily tenant population is only down -0.3%
from March 2020. By contrast, “Bottomed” metros are down -1.8%; “Still declining” metros are down -3.6% (and, by definition, are still dropping).
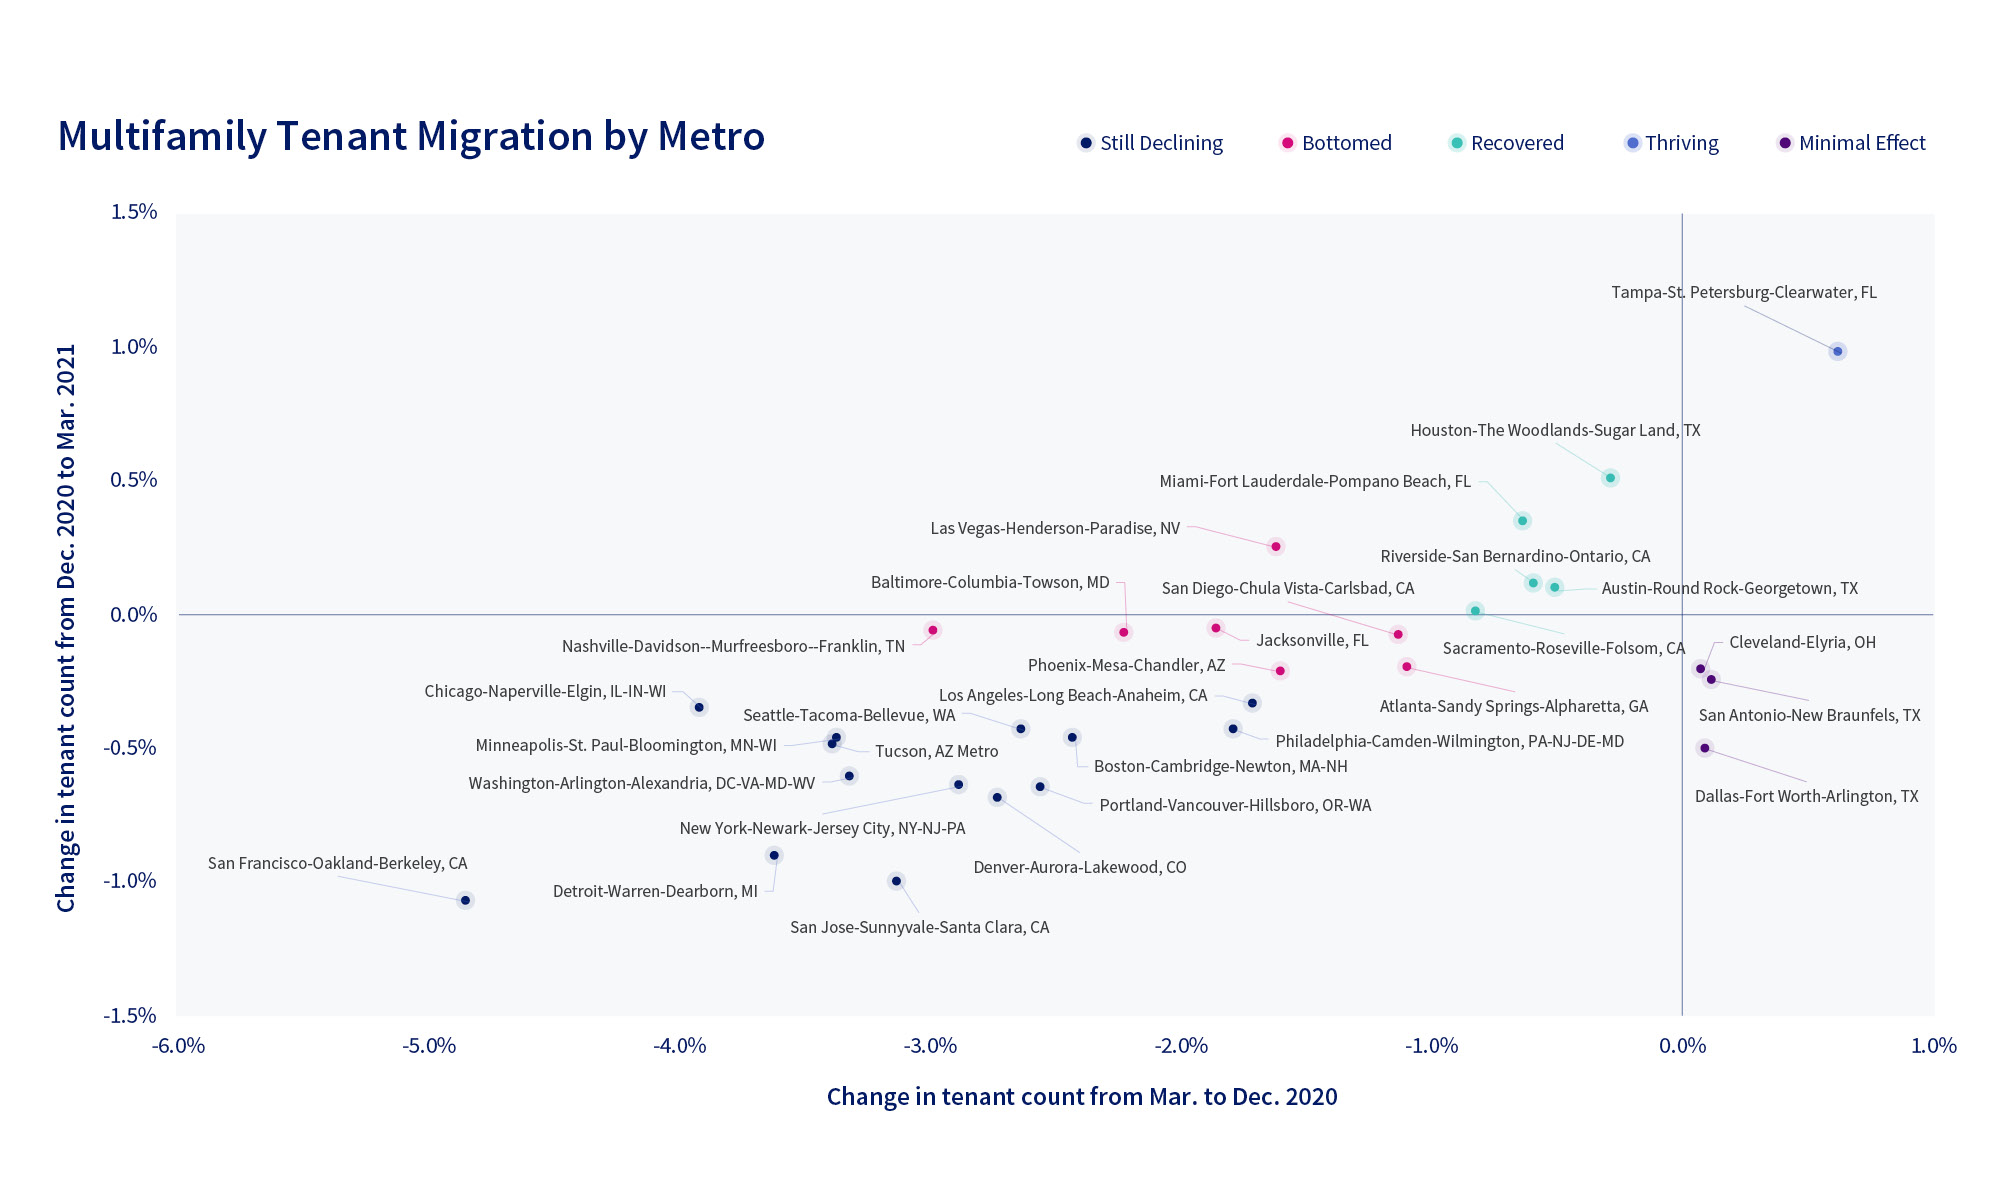
A Moderating Trend
The chart below illustrates what each metro and each segment is experiencing in more detail. It compares multifamily tenant migration from March to December 2020 to more recent migration from December 2020 to March 2021.
The “Recovered” metros hover above the vertex; the “Bottomed” metros cluster on the horizontal line, as they were negative for 2020 but have since been flat. Notably, the “Still declining” segment is in the lower left. The good news is that the rate of decline has slowed for every metro in that group.
Absolute Tenant Gains and Losses
Keep in mind that these data are all relative to the metro areas themselves. Thriving Tampa/St. Petersburg, for instance, saw an absolute gain of around 1,700 tenants. Recovered Houston, on the other hand added three times as many tenants (more than 5,000) with its much larger multifamily market.
And on the flip side, both Los Angeles and San Francisco are still declining. From a percentage basis, the Bay Area lost a staggering 4.8% of multifamily tenants – more than three percentage points above Los Angeles’ 1.7% loss. Tinsel Town, however, is much bigger. In total, it lost just under 7,000 multifamily tenants to San Francisco’s approximately 5,400.
How We Tracked the Data
We are able to track migration because GeoPhy’s Tenant Credit Profile (TCP) tracks the number of adult consumers that reside at a given property. When tenants move, the credit reporting agencies note changes in addresses from data furnishers such as credit card issuers, pay TV providers, and utilities.
TCP’s aggregated credit scores at a building level shield the privacy of individuals. The aggregation also, however, yields a total household count which we compare to the prior month for almost 548,000 multifamily properties across the U.S. We then aggregate these property details at national, state, metro area, and our proprietary Neighborhoods levels.
Our approach has limits. It only tells us net changes in multifamily properties. We know if properties are gaining or losing tenants. But we cannot tell the destination of those tenants.
Some may have moved home with parents during the pandemic. Denver’s three percent decrease in multifamily tenants in the midst of a red hot residential market may indicate millennials moving out to buy their first homes.
Regardless of the reasons, the details about migration patterns help you better understand supply and demand conditions at whatever geographic level you choose. And, of course, we can also give you assurance that an individual property isn’t bleeding tenants.