GeoPhy Launches Neighborhood-Level Multifamily Price Indexes
Provides granular multifamily price trends for 10,000 neighborhoods nationwide

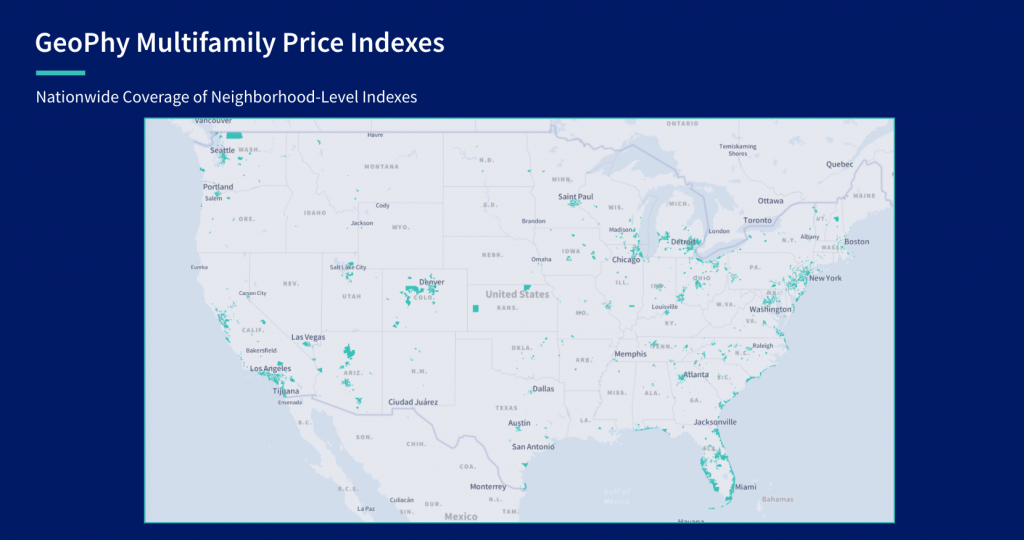
GeoPhy today launched neighborhood-level price-per-square-foot indexes for multifamily properties for more than 10,000 neighborhoods nationwide. Using the indexes, GeoPhy now provides users with 1-, 3-, and 5-year compound annual growth rates for multifamily prices at the neighborhood level. The new capability enhances commercial real estate lenders and investors’ ability to understand the trajectory and evaluate the attractiveness of local areas as part of their analysis.
GeoPhy’s new indexes are updated monthly and provide users estimated price-per-square-foot values back to 2005. With such data, for example, users can determine which Neighborhood in a region suffered most during the 2009-2012 Global Financial Crisis. They can also identify Neighborhoods that have demonstrated the most resilience since the beginning of the Covid crisis.
GeoPhy Neighborhoods break down metropolitan areas into more granular hyperlocal detail than submarkets. On average, there are over 40 neighborhoods in a submarket, and neighborhood characteristics often vary widely within a submarket. It includes crucial metrics lenders and investors use to determine a property’s value such as crime rates, commuting distances, availability of public transportation, as well as local eating and shopping amenities.
Geographic and Temporal Coverage
GeoPhy’s multifamily price indexes provide history back to 2005. We also update transactions on a monthly basis, allowing users to understand historical trends up to the most recent month’s transactions.
The recency of estimates depends on the frequency of sales and the speed at which those new sales are recorded. Estimates are up-to-date through Q1 2021 for 95% of the more than 10,000 Neighborhoods and through September 2020 or later for 99%.
Over 97% of Neighborhoods have a 5-year CAGR above zero and 94% have positive 3-year CAGR. Over a 1-year time horizon, however, only 84% are up with a more dispersed distribution, indicating the disparate impact of the past year’s market turmoil.

GeoPhy’s multifamily price indexes join GeoPhy’s Neighborhoods, Tenant Credit Profile, its automated valuation model (AVM) for multifamily properties, and GeoPhy’s collection of hundreds of individual benchmarks for use in analysis and modeling. Collectively or separately, these features are available as data feeds or as part of GeoPhy’s Evra platform. Industry professionals can sign up for a demo or free trial at https://try.geophy.com/Trial-Features.html.
About GeoPhy
GeoPhy, with U.S. headquarters in New York City, is making the world of commercial real estate more transparent, efficient, and faster. We combine traditional and alternative data sources with machine learning to help clients identify opportunities and manage risks across the market.
GeoPhy Contacts:
Investors:
Teun van den Dries
Founder and CEO
t.vandendries@geophy.com
Media:
Steve Albert
Chief Operating Officer
Phone +1.332.204-6000
s.albert@geophy.com
Phone +1.332.204.6000
PO Box 4668 #77270
New York, NY 10163-4668


