Finding the next Williamsburg — Site Selection Using “Big Data”

For real estate developers and investors, finding “the next Williamsburg” or “the next Soho” is often considered the holy grail. But, how to identify what areas (may) gentrify? At the macro level, site selection is often done using data on demographic trends, including population, employment, and income growth. But once a city has been selected for capital allocation, Census data is not granular enough to be useful.
Enter big data. Because at the level of the city, there are a multitude of data layers that can be used for further differentiation, as detailed as an inch, as frequent as every second. Think about data on bars, restaurants, coffee shops, art galleries, (music) events, crime, the location and frequency of pictures uploaded onto social media, homesharing (e.g. listings on AirBnB), WiFi hotspots, public transport stops, rideshare pick-ups and drop-offs. And all the other data layers that Richard Florida wrote about in his “Rise of the Creative Class.”
These “modern” data layers, which can often be accessed through APIs, lead to unparalleled market intelligence that enables real estate investors, developers and lenders to make more informed, data-driven decision. As opposed to, or perhaps in addition to, “heard” on the street or gut feeling. But the trick is often to access and make sense of all these different layers of information, as most firms are not set up to ingest many different sources of primary data, but are rather used to consuming data in aggregated format (think: data on rent levels, price developments, etc.).
To illustrate how new, granular sources of data can be used by the real estate sector, GeoPhy developed a simple site selection tool, the “Grapevine Dashboard” (after all, we often hear about new, upcoming, cool areas through the proverbial grapevine).
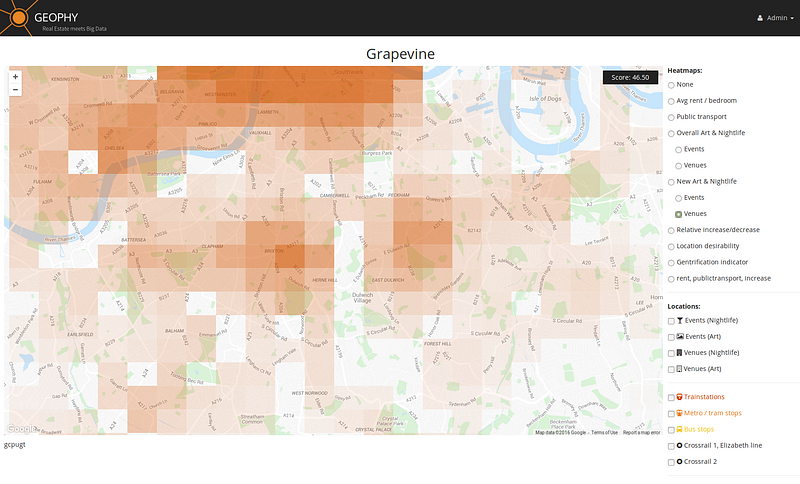
The Grapevine Dashboard pulls a vast real-time dataset of physical venues and one-off events in a city to provide a detailed view of arts, nightlife and other leisure activities. This includes the exact location of amenities like bars, cafes, art galleries, music concerts, food festivals and exhibition openings.
By utilizing proprietary methods to calculate locational proximity and distribution of such venues or events, we can then spatially sort and rank this data across entire cities. This produces views of the city that each tell a different story and enable the user to investigate and test certain assumptions and scenarios surrounding their property investment strategies. For example, which areas have the most independent art galleries? Where is “the next Williamsburg” or “the next Soho”? The picture below shows, for London, which areas have the greatest number of new bars, cafes and restaurants (in this case, those which have opened in the past two years). However, this view can also be filtered to look at a more specific subset of the data, such as restaurants or coffee shops that are not part of the major chains.
The data also allow us to look at less spatially fixed behaviour, such as events that might not take place in a traditional venue; which could be pop-up markets, outdoor cinemas or all-night warehouse raves. In doing so, we can access a view of the city that is rarely seen; and understand which neighbourhoods certain groups of people are likely to go to in order to spend their money and enjoy themselves. Which areas are the most popular for music? Which are the most popular for theatre?
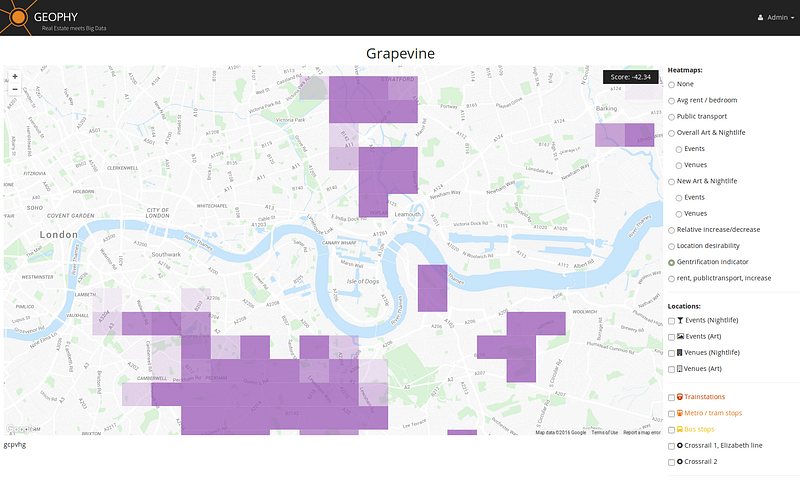
One of the most powerful aspects of the Grapevine Dashboard is in the ability to chronologically analyze the data to reveal long-term neighbourhood trends. For example, the screenshot below shows the relative increase and decrease in overall numbers of new venue openings and events over the past two years. Here we can clearly see that despite the fact that Clapham is undoubtedly a “nice area” in parts, that it actually has fewer new venue openings or events than nearby Brixton. And neither area is as cool as Peckham, which despite being well-known as a newly “trendy” area, is still rapidly increasing in terms of new bar openings or arts events. This is especially important when the latter are known to greatly improve the market value and quality of life in an urban area. Therefore, the Grapevine Dashboard allows us to observe the important real-time trends that are changing the characteristics and market value of urban areas.

The financial indicator for gentrification that we used in our analysis was ‘relative rental increase’, which we tracked over the last 8 years on a per bedroom basis. While correcting for macro-economic indicators such as interest rates and employment rates, we identified the leading indicators for that relative rent rise. Viewing the increase and decrease in an area’s popularity alongside rental price data — combining relative rental levels in a city with relative increase/decrease in local economic vibrancy — thus provided a “gentrification indicator.” Low rent, strong increase in economic activity, that’s what developers and investors should be looking for!
According to the Grapevine Dashboard, London’s most happening neighbourhoods are:
1. Peckham
2. New Cross/Deptford
3. Stratford
And Grapevine’s predictions for the “next Soho” are:
1. Forest Hill
2. Seven Sisters / Tottenham Hale
3. Barking
Of course, macroeconomic data may shift some of the institutional focus away from London. But the concept of GeoPhy Grapevine can equally be applied in every market for every property type.
As the availability of data grows, investment decision making will increasingly be informed through objective analysis. And if it makes you feel better, you can always add a dash of gut feeling.