Evra’s Insights Portal Simplifies Regular Reporting
Our custom reports automate the data collection you need

Preparing monthly performance reports for an entire portfolio means long hours researching and hunting manually for data. Only once you’ve got accurate information can you begin to build out complex spreadsheets and charts. All this to answer the question: How do your properties stack up against your competitors?
No wonder it can induce dread.
Well, Evra by GeoPhy has got your back. With its new Insights Portal feature, Evra can collect all that data in one spot. The Insights Portal delivers custom reports, maps, and dashboards to Evra’s premium customers within a dedicated, secure location. The custom reports can include a combination of client-provided, GeoPhy-provided, or externally sourced data linked to each property.
All Insights Portal material is viewable by each of a client’s Evra users, enabling seamless collaboration across functions. For example, a client may request a custom report showing key metrics on their currently owned portfolio of properties and selected sales comps for each.
At the click of a button, the Insights Portal automates and streamlines your workflow by tracking your portfolio’s performance and benchmarking it against competitors. Evra gives you more time for analysis or to look for actual new investments.
Here are some examples we built using data from properties of publicly traded REITs:
View Your Portfolio’s Overall Property Map
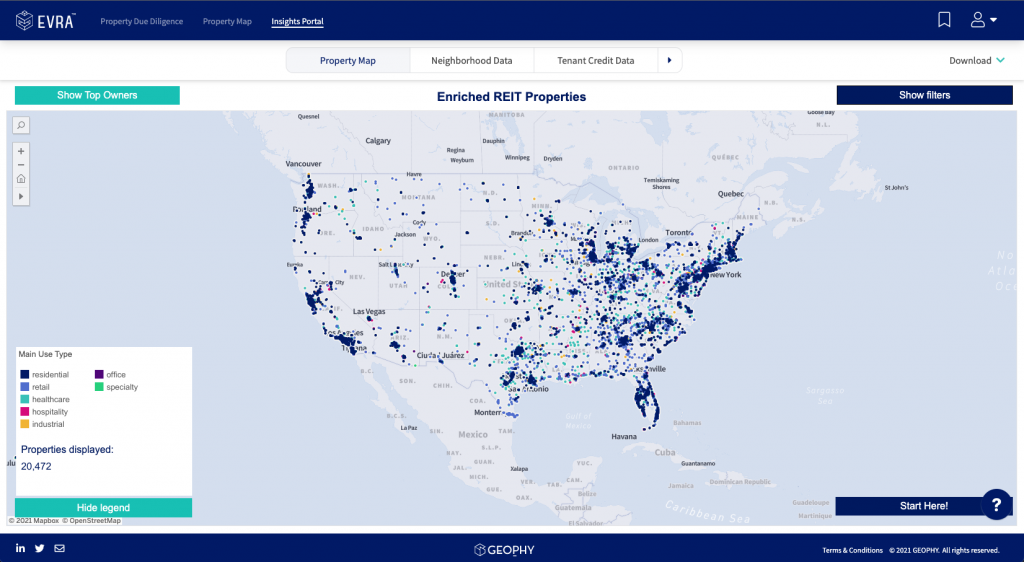
Visualizing the locations of all your portfolio’s assets helps quickly identify areas for expansion. We’re showing all REIT data at a national level here, including non-multifamily properties. But we provide you the ability to filter on whichever property characteristics you like, including various asset classes – and to zoom in to view all your properties within a particular metro area. Remember it is a custom report, built to your needs.
See All Competitor’s Assets
Our REIT dataset includes all REITs, so this example shows all the REITs that have residential properties. The spread is pretty enormous, but by selecting particular competitors – let’s say, Equity residential and AvalonBay for example — you could clear the rest and have the map provide a bird’s eye view of where those competitors’ properties are located compared to yours. (Looks like Texas and Central Florida are fairly wide open!)

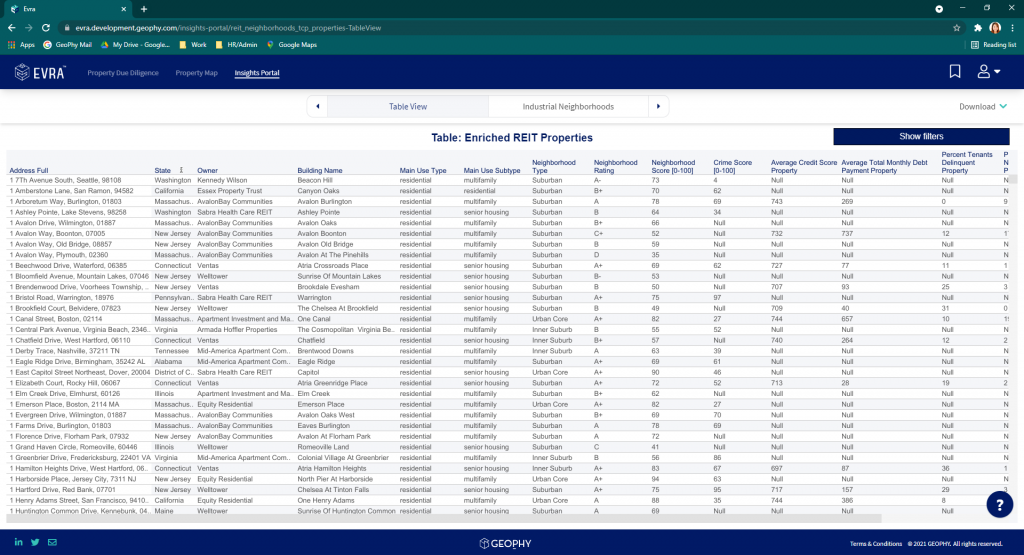
Get a Table View of Your Properties’ Data
We customize the data to fit your needs. We can append your own internal information as well as Evra value drivers to every property – yours or competitors’ – that you seek to track. Our data is updated monthly. We give you all the tools needed to identify key value drivers across geographical locations and perform in depth analysis on market performance.
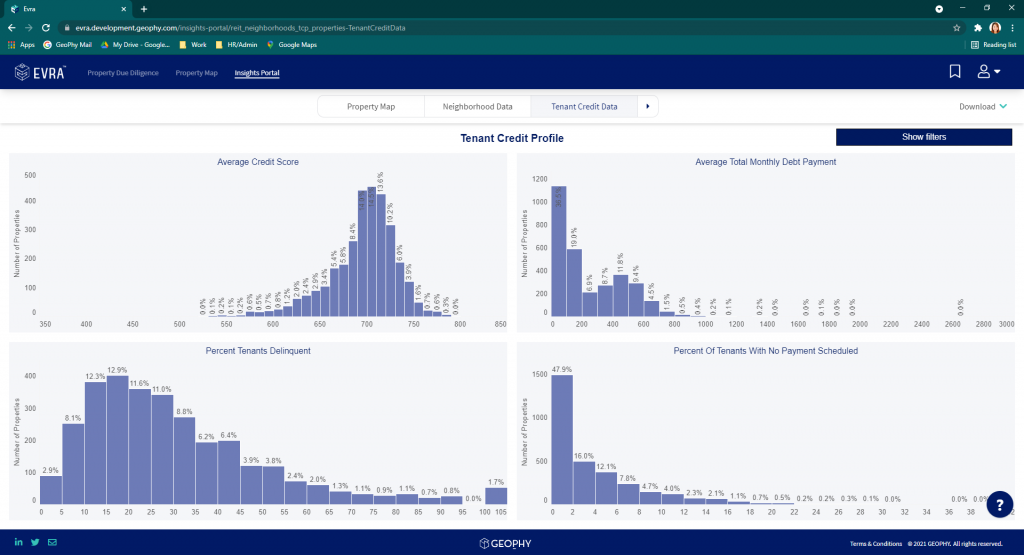
Data Visualizations at the Ready
To help illustrate property data for your organization, we go a step further in constructing customized charts for the value drivers that you deem important. For example, Evra is the only product in the market that provides granular Tenant Credit Profile information, which includes credit scores and metrics aggregated at a property level for all tenants currently living there. You can include these easily digestible charts in your investment memos and reports.
And now comes the golden question: Can all these data – maps, tables, charts – be downloaded? YES!
A quick download of all Evra Insights Portal’s information allows you to seamlessly incorporate them into your spreadsheets or presentation slides. Owners, real estate investors, asset managers, and portfolio managers armed with such data gain visibility into their real estate investments and increase the accuracy of their data collection and analysis. With this data at your fingertips, you are now empowered to make precise strategic decisions quickly and increase returns.
Sign up for a demo to see the data we have available and how Evra’s Insights Portal might work for you.