Data Powers Industrial CRE Location Evaluations
Analyzing underperforming retail loans can yield redevelopment opportunities

Online shopping’s popularity exploded as we accelerated into the new “normal” thanks to COVID-19. According to Digital Commerce 360, US e-commerce grew 44% in 2020.
On the flip side, over 20 North American retailers filed for Chapter 11 in 2020, of which 80% of them did so during the pandemic. Among them: brands that I grew up with like JC Penney and Lord & Taylor.
Who knew that combing through aisles at a mall, touching a piece of clothing’s fabric, then standing in a fitting room line could very soon be a distant memory?
As more brick-and-mortar locations are dying, e-commerce players are keeping an eagle eye out for suitable locations to fulfill their thriving next- and same-day delivery demands. Naturally, there has been a lot of chatter around the idea of seeking out distressed retail spaces and repurposing them into last mile distribution centers.
The key question: Which struggling malls can be converted into effective last mile delivery centers?
Hunting Last Mile Opportunities
GeoPhy’s Industrial Neighborhoods’ Last-Mile Score help us answer that question. The score ranges from 1 (poor) to 100 (excellent) and rates a neighborhood’s attractiveness for last mile delivery based on several metrics, including number of households and aggregate income accessible within an hour’s drive.
We examined 14 CMBX portfolios, which have close to 2,000 underperforming retail loans covering more than 1,500 unique properties. As expected, not every dead or dying mall is ideal for conversion to last mile delivery centers.

Amazon, the e-commerce behemoth, does a pretty good job of setting an industry benchmark for last mile delivery. So, we use Industrial Neighborhoods to reverse engineer those characteristics Amazon values when picking a specific location for its delivery stations.
Amazon delivery stations’ primary role is to sort packages for outbound routes to enable last mile delivery to customers within a defined urban area. Amazon aims for these last mile delivery centers to service a 45-mile radius.
The stations are usually positioned within larger metropolitan cities across the country. However, this is starting to change as these facilities are now being opened in smaller market areas.
GeoPhy’s Last Mile Score for Amazon’s last mile delivery centers shows 60% of them have a score of >70; 25% have a score of at least 90.
Only 10% of Amazon’s stations score below 50. Why would Amazon choose these low scoring locations? The bulk of those are in smaller, less dense metro areas – like Appleton, Wisconsin – which by definition have less attractive and lower scoring, neighborhoods. Of the properties that are in Amazon’s bottom 10% tranche, two-thirds are located in the top half of neighborhoods in their respective Metro areas. If you wish to emulate Amazon’s success in strategic placement of last mile distribution assets, pick locations with similar ideal geographic characteristics.

Combing Through CMBX Data
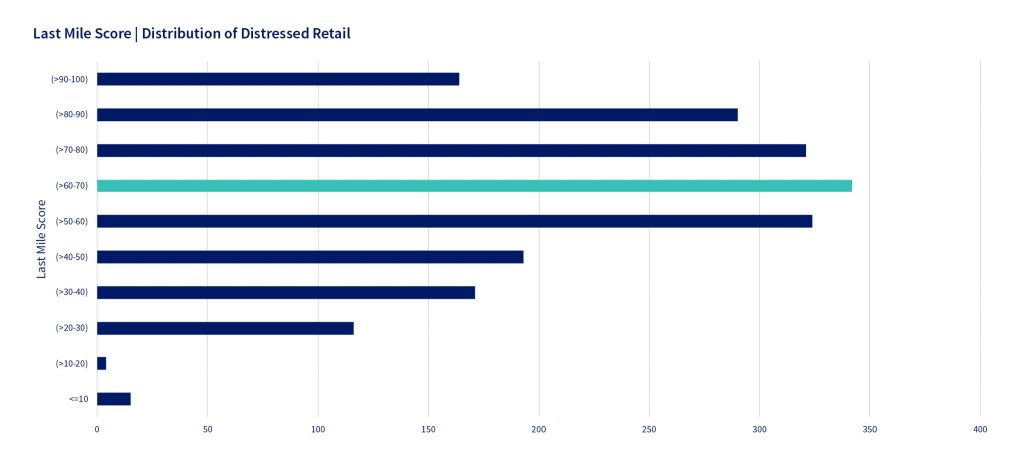
Most of the properties in the CMBX portfolios with underperforming retail loans have an above average Last Mile Score. The largest number of such loans are in the >60-70 range. There are tons of options to choose to satisfy investors’ investment strategies, from various states and cities.
The top 3 MSAs with the largest number of under-performing retail properties are:
- New York-Northern New Jersey-Long Island, NY-NJ-PA
- Chicago-Naperville-Joliet, IL-IN-WI
- Detroit-Warren-Livonia, MI
This list highlights a crucial characteristic when repurposing retail properties into last mile delivery centers: Look for a land-constrained market like suburban NYC or Chicago. These locations have the infrastructure needed for efficient delivery. They have ample truck parking and ceiling heights of at least 30 feet high. This infrastructure significantly cuts down on an investor’s redevelopment costs.
A Tale of Two Malls
To illustrate our point further, here we have two Regional Malls, whose loans are not performing.
Montgomery Mall in North Wales, PA with an outstanding Last Mile Score of 91 and Meadows Mall located in Las Vegas, NV with Last Mile Score of 30. Both of these locations were built in the late 70s and anchored by known brands like Macy’s and Dillard’s. Why is the last mile score drastically different?
The Last Mile Score takes into account accessibility to demand – the number of households within a 60-minute drive and those households’ total income. The population per square mile within an hour’s drive of Montgomery Mall is 20 times more than that within an hour’s drive of Meadows Mall. It’s more efficient to place a distribution center in the Pennsylvania mall than the Nevada one. Demand will be more in the former as it will be serving more households.
On top of that, the number of wealthy households around Montgomery Mall is also about five times denser than around Meadows Mall. The total income with a 60-minute drive is over $300M for Montgomery Mall vs. $70M for Meadows Mall. Households with higher disposable income will presumably shop more, driving greater demand for fast reliable delivery services.
Workforce Demographics
Proximity to customers is not the only consideration in a successful last mile delivery center. According to some estimates, just 30% of the total delivery cost to a business comes from the last-mile. One of the biggest costs is labor – specifically the availability of Production, Transportation, and Material Moving (PTMM) labor.
Investors have a lot of options when thinking about repurposing retail spaces into delivery centers. Top locations with high quality dysfunctional malls like Chicago or New York are pricey. To add to the problem, not all of these locations’ are zoned for such land use requirements.
We recognise that it can be challenging to find the right mall for conversion. But with GeoPhy’s instantly available data and insights, we can do the heavy lifting for you. We can narrow down the search so that you can focus on what matters to you when investing in Industrial properties.


