Analyzing Industrial Supply with Evra
A process to finely identify market demand and competition

Amid the COVID-19 pandemic, e-commerce has continued to fuel the demand for distribution and last mile facilities. No wonder industrial has proven to be one of the most resilient commercial real estate asset classes in 2020-2021!
Not just any industrial opportunity is attractive in the current market environment. Investors first need an approach to understand existing fundamentals in a given target area. Here’s one we’ve developed that helps identify properties to pursue and those to avoid.
Investors seeking to increase their footprint by purchasing a last mile facility or a developer contemplating constructing a new one must consider two factors:
Is there sufficient market demand?
What is the competitive landscape around the location under consideration?
Determining Demand
For the first question, GeoPhy’s Evra platform has an Industrial Neighborhood metric that fits the bill: the Last Mile Score. It synthesizes how much addressable market exists around a Neighborhood.
A quick side note: Evra’s proprietary Neighborhoods feature groups similar Census Blocks to create more granular views of areas than submarket analyses. We divide the U.S. into 94,000 neighborhoods, of which 55,000 have industrial assets. For each of those neighborhoods, we have numerous Value Drivers that factor in properties’ values – including the Last Mile Score.
Households with high income situated in dense areas have a higher propensity to shop online and shop online more often. These behaviors drive demand for last mile fulfillment services.
We calculate the Last Mile Score using data points like the number of high income households accessible within an hour’s drive and the overall population density within that area. It allows investors to target those Neighborhoods within any market that are best situated to support last mile facilities.
Quantifying Competition
Having identified a target Neighborhood, let’s take a deeper dive into the competitive supply to identify which areas within a Neighborhood are under- or over-served by industrial assets.
For our analysis, we assume that any industrial property within a five-minute drive of a target property is a direct competitor. It will be serving the same target market.
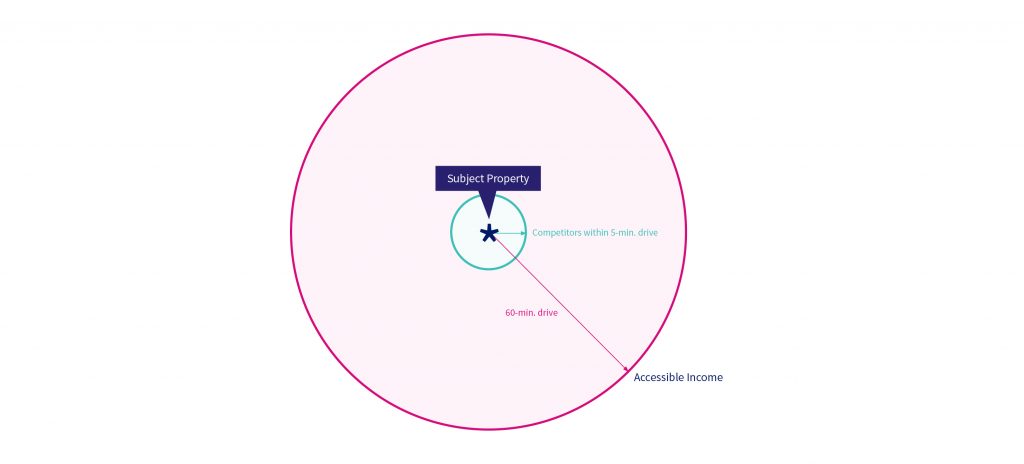
Now let’s take the total household income within a 60-minute drive of the Neighborhood center – one component of the Last Mile Score – and divide it by total industrial square footage within a 5-min drive of a candidate property. This approach yields Addressable Income per Square Foot of Warehouse.
Whether due to greater household income or fewer competitors, properties with higher values for this ratio are more attractive than properties with lower values.
Real World Analysis: Atlanta
To illustrate this approach, we analyzed the Atlanta metro area. We picked properties in the top 20% of Neighborhoods by 60-minute Income Reach. We then calculated the Addressable Income per Square Foot of Warehouse for each of the zip codes in the table below.
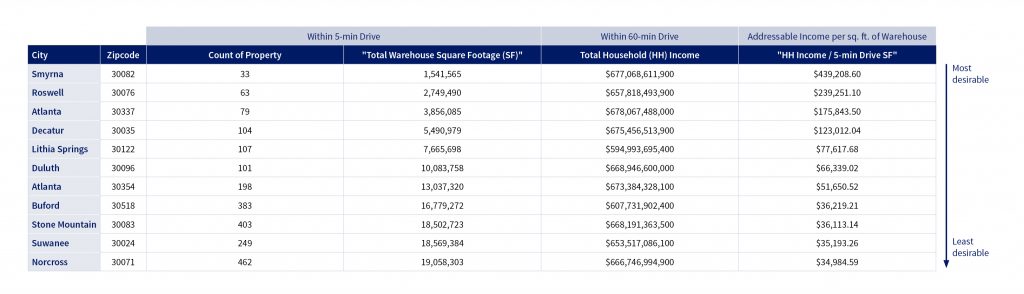
Taking competitive supply into account reveals stark differences among the properties. At over $430,000, the property in Smyrna has a significantly higher Addressable Income per Square Foot of Warehouse compared to the rest of the group. For every square foot of warehouse space near that property, there is an addressable income of $430,000 that can contribute to the demand for fast delivery services. Since the area is currently underserved by industrial space, there is huge potential for upside at the Smyrna location.
At the other end of the spectrum, the property in Norcross has a similar income reach, but far greater competitive supply. The Addressable Income per Square Foot of Warehouse is less than 10% that of the Smyrna property. It is much less desirable as an investment. Any investor thinking of going into this zip code should think twice before adding to the already saturated supply pool.
As retail sales remain strong and transactions from e-commerce continue to soar, industrial demand from investors will remain strong for the foreseeable future. Still, we believe in the importance of maintaining a full picture of the existing supply in any given area and for any given property. At GeoPhy, we can help you make informed decisions by enabling fast analysis at your fingertips.